About 5 minutes to read
A suspension figure looks simple: a number of students sent home. Read from the bottom up, it is the sum of many separate moments in which an adult decided what a student’s behavior meant and what should happen next.
This is the next post in the series that began with Reading special education data from the bottom up, after Inclusion and the least restrictive environment. It is a short guide to the discipline figures for your district: what they count, what IDEA requires, and what to ask. The full version is the atlas guide Discipline data for students with disabilities.
What the numbers count
The discipline figures in the IDEA Atlas come from the Civil Rights Data Collection, gathered by the U.S. Department of Education’s Office for Civil Rights from nearly every public school. The atlas uses the 2023–24 collection.
For students with IEPs, students with Section 504 plans and students without disabilities, the atlas shows how many of every 100 students in each group were suspended out of school, expelled, restrained, secluded, or referred to law enforcement. Each rate uses its own group as the base, so a group of 300 can be compared with a group of 3,000.
The figures count students, not suspensions. A student suspended five times counts once.
Reading a comparison
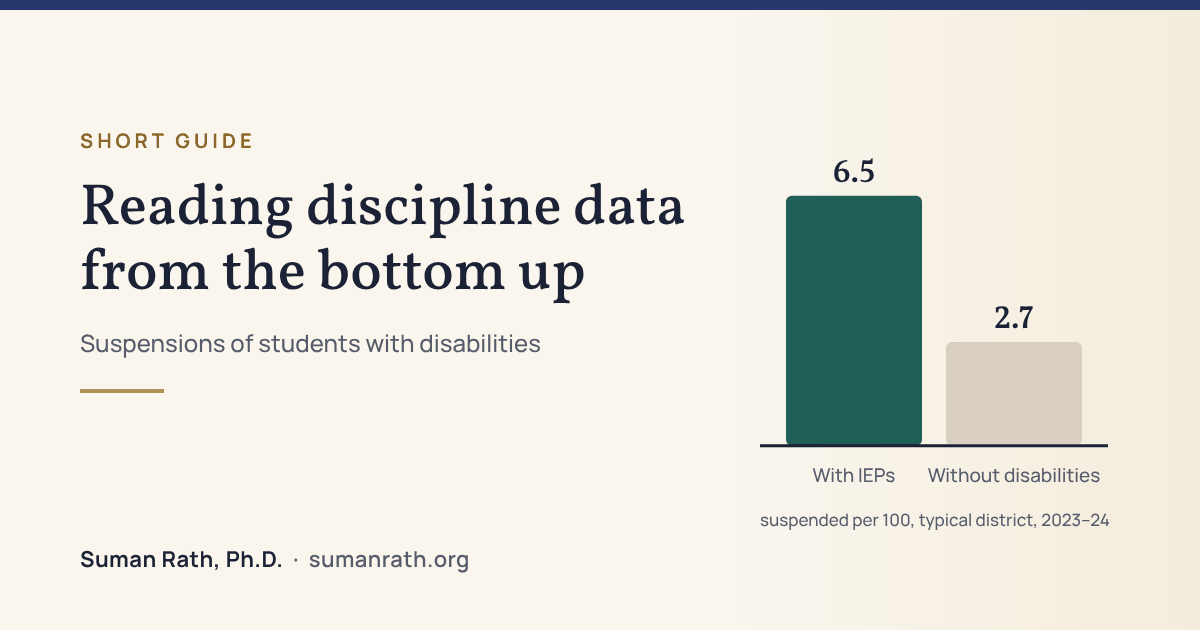
Take Paterson Public School District in New Jersey. In 2023–24, 21.8 of every 100 students with IEPs there received an out-of-school suspension, compared with 11.2 of every 100 students without disabilities. A student with an IEP was about twice as likely to be suspended at least once.
Before drawing a conclusion, check two things under “Full detail” on the district page: how many students the rates stand for, and whether any figures were withheld for privacy. Restraint and seclusion counts are often small, and a single student can change them a great deal.
What IDEA requires
Students with IEPs can be disciplined, but IDEA adds protections once removals add up (34 CFR 300.530–300.536).
- Up to 10 school days. A school may remove a student with a disability for up to 10 school days in a row for breaking a code of conduct, as it would any student.
- After 10 days in a school year, the school must keep providing services during any further removal, so the student can keep working toward IEP goals.
- A change of placement happens when a removal lasts more than 10 school days in a row, or when shorter removals add up to more than 10 days and form a pattern.
- Manifestation determination. Within 10 school days of deciding on a change of placement, the district, the parents and relevant IEP team members must decide whether the behavior was caused by the disability, or had a direct and substantial relationship to it, or was the direct result of the district not carrying out the IEP.
- If it was, the team must do a functional behavioral assessment and put in place, or review, a behavioral intervention plan, and the student generally returns to the prior placement.
Special rules allow removal to an interim setting for up to 45 school days for weapons, drugs or serious bodily injury, whatever the manifestation finding.
What the numbers leave out
Many districts send students home early or ask families to pick them up. These informal removals often do not appear in suspension counts, but they can still count as removals under IDEA. A low suspension rate is not proof that students are staying in class.
IDEA’s discipline rules are mostly timelines and procedures: count the days, hold the meeting, write the plan. Thomas Skrtic (2005) warned that requirements like these can produce ceremonial compliance, where the steps are done and practice stays the same. Catherine Voulgarides (2018) found this pattern in districts cited for discipline disparities: staff worked hard to show compliance, and the conditions that led to the suspensions changed little.
When a student is removed, who decides what the behavior means, and are the student and family part of that conversation?
Kozleski and Smith (2009) found that the stories adults tell about children shape how reforms play out in a school. A suspension figure carries those stories inside it.
Questions to ask
- How many school days has my child missed because of removals this year, including early pickups and partial days?
- Has the team done a functional behavioral assessment? Is there a behavior plan, and is it being followed?
- How does the district’s suspension rate for students with IEPs compare with students without disabilities, and with the state?
- What does the district do instead of suspension, and is it available at every school?
- What does the school change about the classroom or the day, not only about the student?
Look up your district
Every district page in the IDEA Atlas has a “Discipline and safety” section, with the same figures for students with IEPs, students with Section 504 plans and students without disabilities, side by side with the typical district in your state.
Sources
- 34 CFR 300.530–300.536, discipline procedures under IDEA.
- Kozleski, E. B., & Smith, A. (2009). The complexities of systems change in creating equity for students with disabilities in urban schools. Urban Education, 44(4), 427–451. https://doi.org/10.1177/0042085909337595
- Skrtic, T. M. (2005). A political economy of learning disabilities. Learning Disability Quarterly, 28(2), 149–155.
- Voulgarides, C. K. (2018). Does compliance matter in special education? IDEA and the hidden inequities of practice. Teachers College Press.
- U.S. Department of Education, Office for Civil Rights, Civil Rights Data Collection, 2023–24, as shown in the IDEA Atlas. National figures are for districts that fully reported both rates.